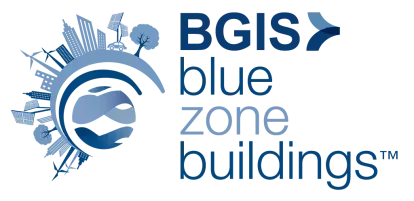
CN Tower is a BGIS Blue Zone Building™
The CN Tower is recognized as a BGIS Blue Zone Building™, meeting eight core health and wellness standards that create a safer, cleaner, and more supportive environment for everyone inside.
What it means to be a Blue Zone Building:
- Regular HVAC Maintenance – Ensures consistent air circulation
- Enhanced Air Filtration – C-POLAR™ filters capture fine particles and bioaerosols
- Annual Air Quality Testing – Meets BGIS standards for safe CO₂ and PM2.5 levels
- Water Infiltration & Mould Monitoring – Prevents moisture-related risks
- Annual Drinking Water Testing – Confirms safe, clean water
- Legionella Risk Management – Regular cooling tower inspections
- Non-VOC Cleaning Products – 100% biodegradable and made from natural-based ingredients
- Radon Testing – Conducted every five years for long-term safety
This recognition ensures that guests and employees benefit from a healthier, more comfortable, and environmentally responsible space - every day. Learn more here.
Sustainability
From 2006 to 2020, we achieved a 91.8% reduction in our greenhouse gas emissions, the result of careful data analysis and thoughtful planning.
Here are just some of the ways we’ve lowered our emissions recently:
- Retrofitted to LED lighting
- Installed a ventilation-on-demand control system for our kitchen
- Installed a food-digesting system to maximize our waste diversion rate
- Upgraded to low-flow plumbing fixtures
And our work is far from done. In the coming years, we’ll be eliminating ozone-depleting refrigerants from our operations, and introducing best-practices training for energy and water conservation—and thinking up innovative ways to decrease our footprint even further!
Emissions
- A reduction of 45,792 metric tonnes of GHG emissions since 2006
- Equivalent to taking 9,954 cars off the road for one year
Water consumption
- A reduction of more than 71 million litres of water since 2015
- Equivalent to 28 Olympic swimming pools
Hydro
- A reduction of more than 59 million kilowatt hours since 2006
- Equivalent to 394 million kilometres driven by electric passenger vehicles
Waste
- As of May 2023, the Tower's Diversion Rate is 75.1%, exceeding our 2030 target of 75%. Our Capture Rate, a ratio that reflects the total mass of all materials diverted to reuse or recycling this year, divided by the total mass of all materials, reached 96.7%
- A total of 504 metric tonnes of waste was diverted from landfill in 2019. Equivalent to 29 waste trucks